
Scoring Model
This article is part of the "Full-cycle CRM Optimization" series.
Score to prioritize, not to complicate
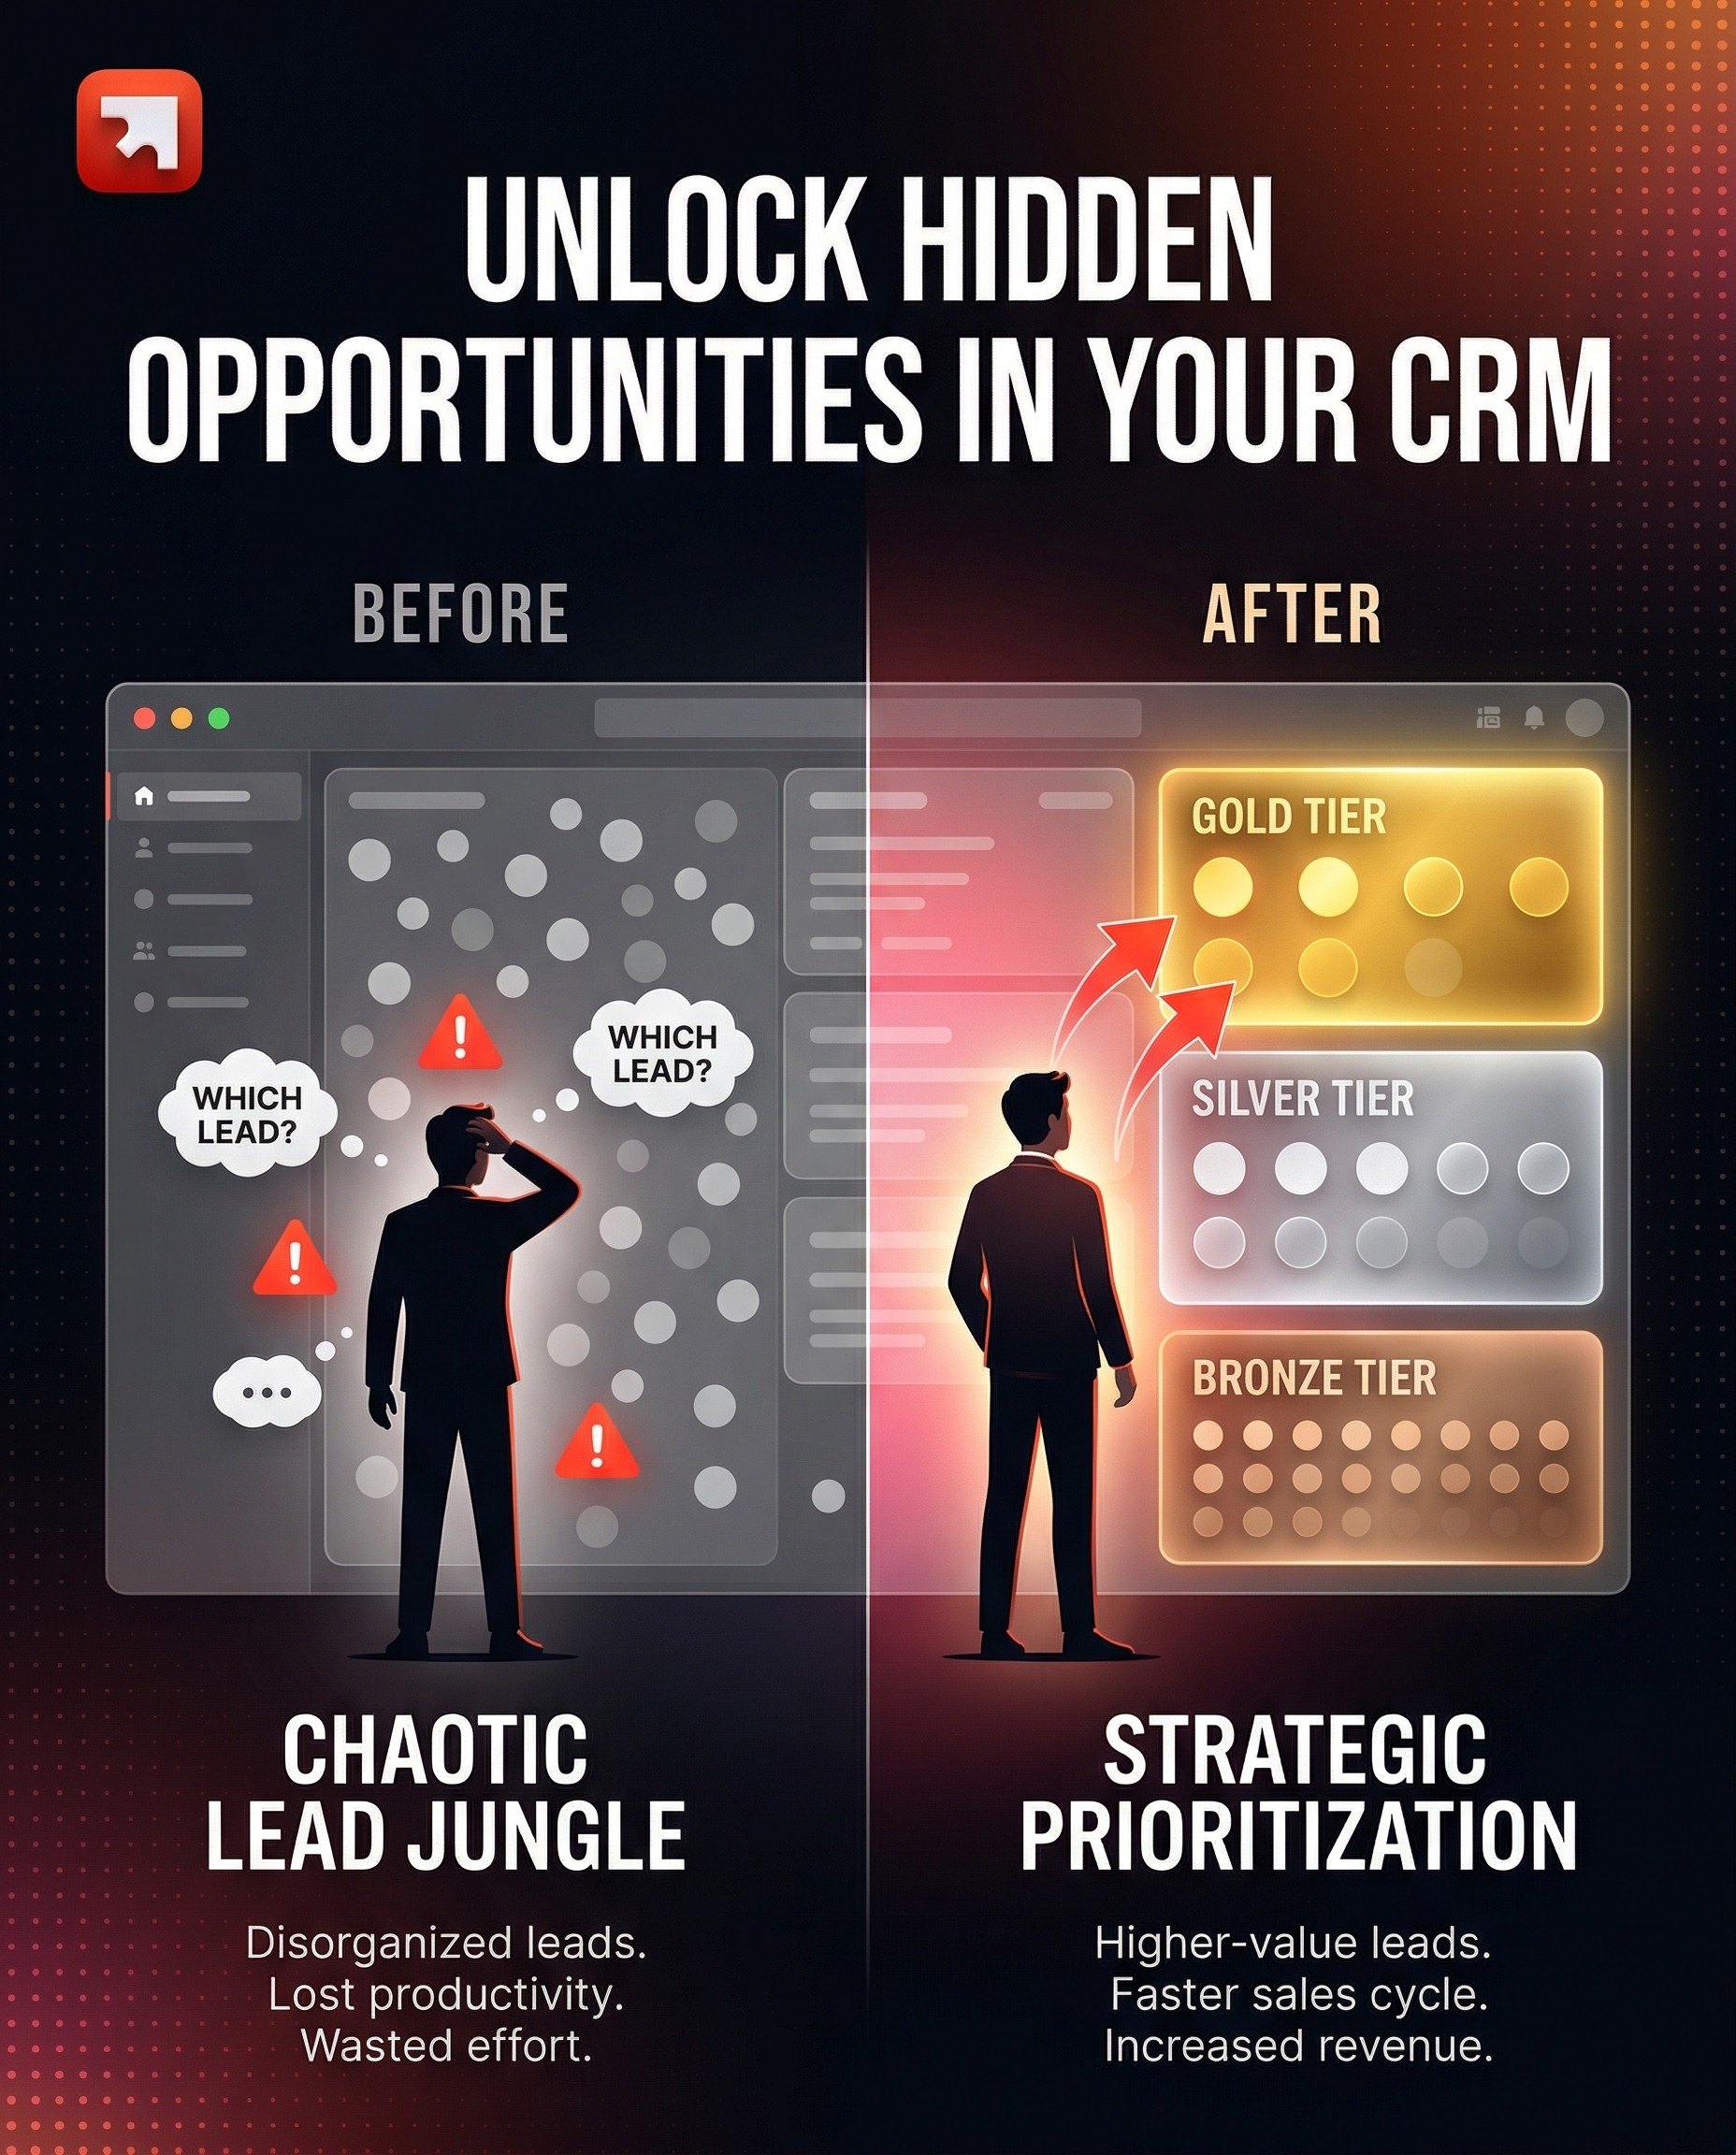
A scoring model is a structured way to rank your accounts and leads so that sales knows who to reach, when, and in what order. It turns enriched data and intent signals into a single, readable number that drives prioritization, routing, and follow-up.
Without scoring, every account looks equally important, and that means reps waste time on low-fit companies while high-potential ones go untouched. With scoring, the CRM stops being a list and starts being a prioritization engine.
What you should get at the end (the deliverables):
an Account Fit Score (how well does this company match your ICP),
a Hotness / Intent Score (how actively is this company or contact showing buying signals right now), and
a Tier System (A / B / C) that maps scores to concrete sales actions (SLAs, assignment rules, follow-up cadence).
If those three outputs aren't clearly produced, you don't have a scoring model, you have a number that no one uses.
Why scoring comes after enrichment (and not before)
Scoring without clean, enriched data is guessing with a formula on top.
If your industry field is empty for 40% of companies, any industry-based score is wrong 40% of the time. If employee count is outdated, your size-based weighting is fiction. That's why our RevOps method always sequences Audit → Clean → Enrich → Score.
The data tells you:
Gartner notes that companies with high conversion rates use an average of four criteria to score leads, not forty. You don't need perfect data on everything. You need reliable data on the few fields that actually predict conversion.
According to Forrester (2024), businesses using scoring models see up to a 38% increase in lead-to-opportunity conversion and a 28% shorter sales cycle.
Yet B2B SaaS companies using behavioral scoring achieve 39–40% MQL-to-SQL conversion rates, far better than those relying on basic demographic scoring alone.
The takeaway: scoring works, but only on top of trusted data. Without the previous steps (audit, cleaning, enrichment), you're scoring garbage in and prioritizing garbage out.
The two scores you need (and why they're different)
Most teams build one score and call it done. That's a mistake. A good scoring system has two distinct dimensions:
Account Fit Score (static: "Is this company our type?")
This answers: does this company match our Ideal Customer Profile?
It's based on firmographic data that changes slowly:
Industry / sub-industry (how well does this vertical align with our product?)
Company size (employee count or revenue range, what's our sweet spot?)
Geography (are they in a market we serve?)
Tech stack signals (do they use tools that indicate a need for our product?)
Values / culture fit (optional, e.g., B-Corp status, ESG alignment)
The Account Fit Score is relatively stable. A company that scores well today will still score well next month, unless they go through a major change (acquisition, pivot, layoffs).
Hotness / Intent Score (dynamic: "Is this company buying right now?")
This answers: is this company showing signals that suggest active interest or readiness to buy?
It's based on behavioral and time-sensitive data:
Website visits (especially high-intent pages: pricing, case studies, capabilities)
Content engagement (downloads, webinar registrations, newsletter signups)
Social signals (following your company or competitors on LinkedIn)
Job posting velocity (hiring for roles that signal a need for your product)
Demo or trial requests (the strongest intent signal)
Employee growth or funding rounds (expansion signals)
The Hotness Score is volatile. It can spike when a company visits your pricing page three times in a week and decay when they go silent for 60 days.
Why two scores, not one?
Because combining fit and intent into one number hides the most important insight: is this company a great fit that's not active yet (nurture), or a mediocre fit that's very active right now (qualify fast)?
A useful mental model is the Fit × Intent quadrant:
High Fit + High Intent → Tier A: sales priority, immediate outreach
High Fit + Low Intent → Tier B: nurture, warm up, enroll in sequences
Low Fit + High Intent → qualify: they're interested, but are they worth it?
Low Fit + Low Intent → deprioritize or exclude from active prospection
THE STAGES
The Scoring Execution Plan
Stage 1: Define what you're scoring (and for whom)
Before opening HubSpot or Salesforce, answer three questions with your sales and marketing leaders:
What object are we scoring? Usually companies (account scoring) and/or contacts (lead scoring). Start with companies, it's where the highest ROI is for B2B.
What decision does this score drive? Assignment? Outreach priority? Tier classification? If the score doesn't trigger an action, it's decoration.
Who needs to validate the model? Scoring is a shared language between marketing and sales. If sales leaders don't agree with the weights, they won't trust the output.
A practical tip: involve sales leaders in defining the scoring criteria before implementation. Share a first proposal (a short video or a one-page doc), collect feedback, then iterate. This is not optional, it's the difference between a score that gets used and one that gets ignored.
Stage 2: Build the Account Fit Score
The Account Fit Score is the simpler of the two. It's a weighted sum of firmographic attributes, each mapped to your ICP.
How to structure it:
Pick 3–5 firmographic criteria. For each, define a scale of points (positive for good fit, negative for poor fit or unknown). Here's a generalized framework:
A. Industry Fit (weight: moderate)
Map each industry or sub-industry to a score. Your best-performing verticals get the highest points. Industries you've never closed in get zero or slightly negative. "Unknown" always gets a penalty, it signals incomplete data that needs fixing.
Example logic:
Top-tier industries (historically high win rate): +10
Mid-tier industries (some traction): +5 to +8
Low-tier or irrelevant industries: 0 or negative
Unknown: −5
B. Company Size: Employee Range (weight: high)
Company size is often the strongest predictor of deal fit. Define your sweet spot and assign the highest score there, with decreasing points as you move away from it.
Example logic:
Sweet spot (e.g., 1,000–10,000 employees): +20 to +25
Adjacent ranges: +10 to +15
Too small or too large: 0 or negative
Unknown: −5
C. Annual Revenue (weight: high)
Revenue indicates budget capacity. Same logic as employee count: define brackets, assign points, penalize unknowns.
D. Bonus signals (weight: low to moderate)
B-Corp or ESG status (if cultural alignment matters to your sales motion): +10
Recent funding round: +5 to +10
Headcount growth trend: +5
Technology stack match (e.g., they use a tool your product integrates with): +5 to +10
E. Penalties
Geography outside served markets: −5
Too-small revenue or headcount: negative score
Unknown values on critical fields: always penalize (this also incentivizes data enrichment)
Total score range example: −25 to +70, depending on your criteria.
Tier classification (the part that makes the score actionable):
Tier A (sales priority): score ≥ 45
Tier B (validate / nurture): score 25–44
Tier C (low fit / incomplete data): score ≤ 24
These thresholds should be adjusted after your first QA cycle (see Stage 5).
Stage 3: Build the Hotness / Intent Score
The Hotness Score is harder to build because it depends on signals that are often scattered across tools (CRM, website analytics, marketing automation, LinkedIn, third-party intent providers).
How to structure it:
Map each intent signal to a point value based on how strongly it correlates with actual buying behavior. Signals that historically precede closed deals get more weight.
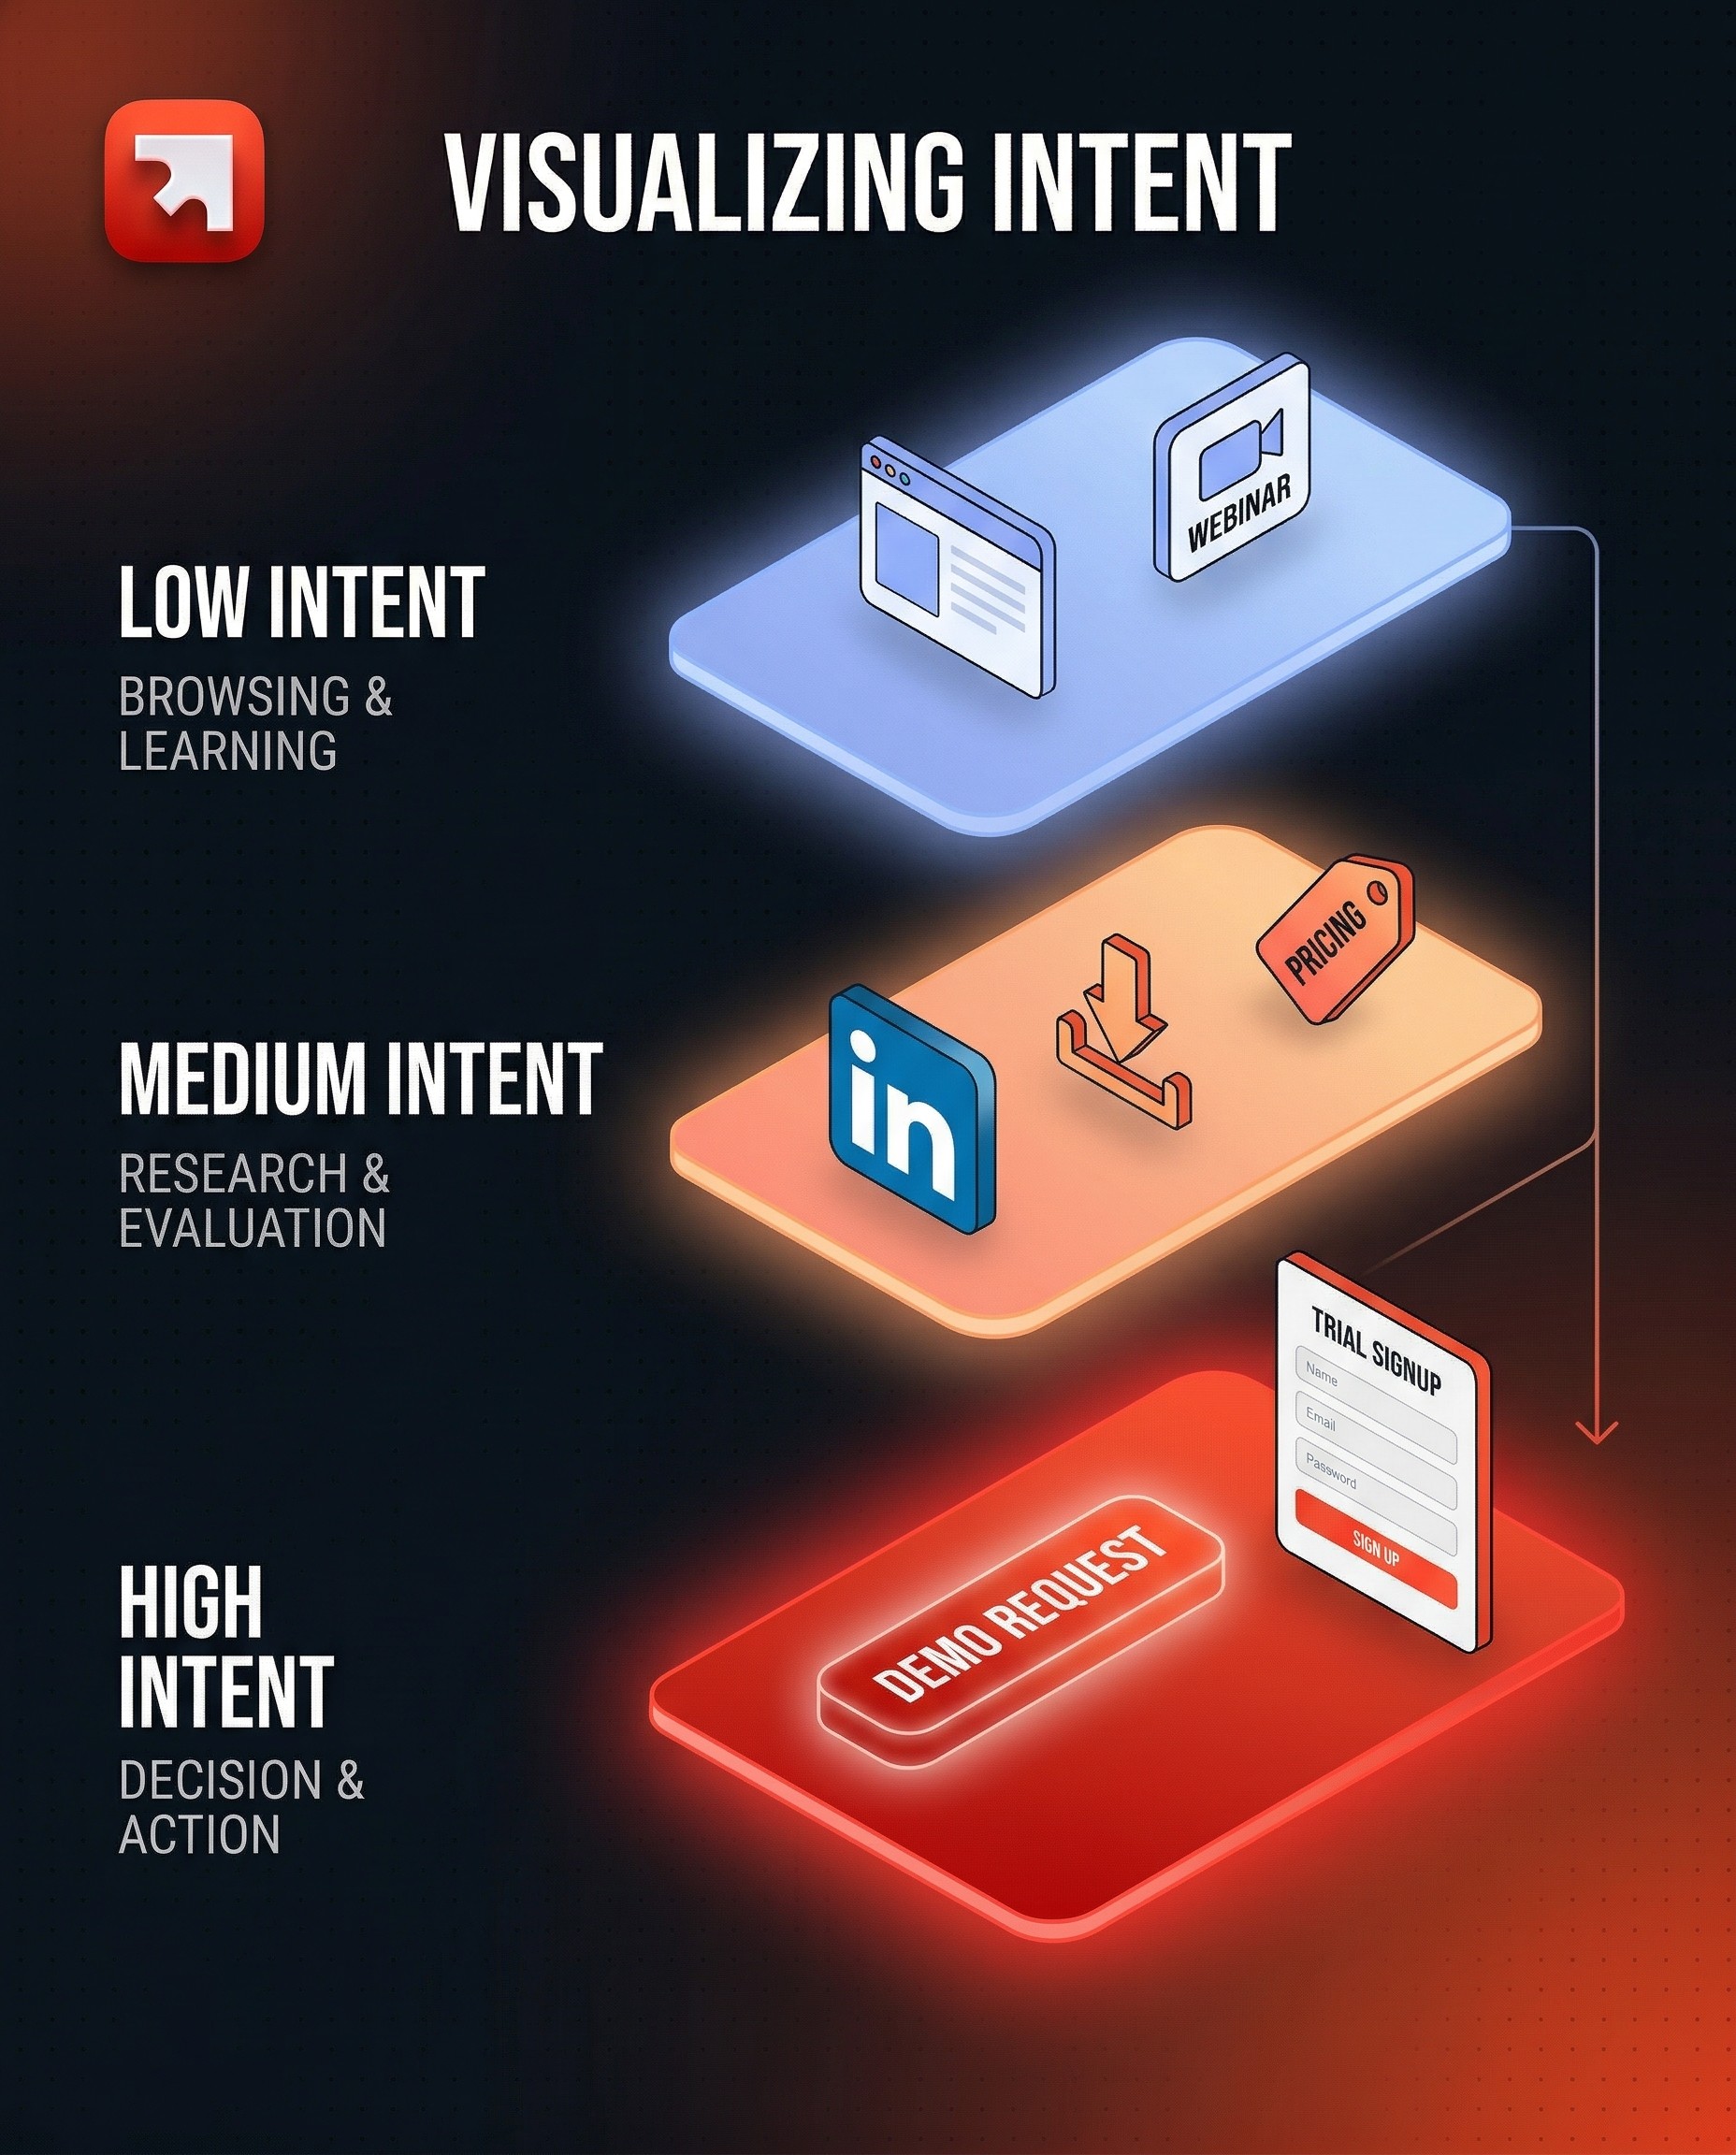
Low Intent signals (+5 each):
Visited the website (general pages)
Registered for a webinar
Followed a competitor on LinkedIn
Medium Intent signals (+10–15 each):
Followed your company on LinkedIn
Downloaded a content asset (whitepaper, guide)
Subscribed to newsletter
Visited pricing page
High Intent signals (+20–40 each):
Requested a trial
Requested a demo (this is often the strongest signal, give it the highest weight)
Submitted a contact form
Operational rules:
Decay: Intent scores should decay over time. A website visit from 90 days ago is not the same as one from yesterday. Most CRMs let you set a rolling window (e.g., "in the last 60 days") or explicit score decay.
Caps: Set a maximum per signal group to avoid one behavior inflating the score. For example, cap website visit points at +20 even if a contact visits 50 pages.
Exclusions: Exclude known bad contacts (bounced emails, quarantined records) from scoring to keep the model clean.
Known contacts only: Most CRM-native scoring (including HubSpot) only works for identified contacts. Anonymous visitors won't be scored unless you use a third-party tool that de-anonymizes traffic.
Stage 4: Implementation in the CRM
Once the scoring logic is validated by sales, implementation is mostly configuration, not code.
In HubSpot:
HubSpot's Lead Scoring tool (under Marketing → Lead Scoring) lets you create multiple score properties. A common setup:
Score 1: Account Fit Score (on the Company object), uses property-based criteria (industry, employee count, revenue, etc.)
Score 2: Web Pages / Intent Score (on the Contact object), uses web events and behavioral criteria
Each score creates two properties:
A numeric score value (e.g.,
company_fit_score)A threshold label (Low / Medium / High) based on ranges you define
In Salesforce:
Salesforce doesn't have a native equivalent of HubSpot's point-based scoring UI, but you can build scoring with:
Flows + formula fields for rule-based scoring
Einstein Lead Scoring (AI-based, requires Sales Cloud Einstein)
Third-party tools (LeanData, Madkudu, etc.) for predictive scoring
In Cargo (or similar orchestration tools):
For teams that need scoring logic that spans multiple data sources (CRM + warehouse + third-party signals), tools like Cargo let you build scoring models that pull from everywhere and push the final score back to the CRM. This is especially useful when intent signals live outside HubSpot (e.g., scraped job postings, LinkedIn data, product usage events).
Regardless of the platform, the implementation steps are:
Create the score properties (numeric + threshold)
Configure the criteria and point values
Define threshold ranges (what constitutes Low / Medium / High, or Tier A / B / C)
Set exclusion rules (quarantine lists, bounced contacts)
Test on a sample (see Stage 5)
Document everything (the logic, the thresholds, the sources of each signal)
Stage 5: QA, calibration, and the feedback loop
A scoring model is wrong on day one. That's expected. The value comes from the calibration loop.
A) Sample testing
Before going live, test the score on a sample of 5,000–10,000 companies (or whatever represents a meaningful slice of your database). Review the output:
Do the Tier A companies actually look like your best accounts?
Are there obvious misclassifications (a clearly great company in Tier C, or a poor fit in Tier A)?
Is the distribution healthy? (If 80% of companies land in Tier A, your thresholds are too generous.)
B) Sales validation
Show the scored output to sales leaders. Ask them to flag:
Companies that scored high but shouldn't have
Companies that scored low but are actually great targets
Any criteria that feel over- or under-weighted
This is the step most teams skip, and the reason most scoring models die within 3 months.
C) Iterate and lock
Adjust weights and thresholds based on the feedback. Then lock the V1 model for 4–8 weeks of real-world usage before making further changes. Changing scores weekly destroys trust.
D) Ongoing monitoring
After go-live, track:
Score distribution (are tiers balanced? is the curve shifting?)
Conversion by tier (do Tier A companies actually convert more than Tier B?)
Score accuracy (what % of closed-won deals came from Tier A? If it's below 50%, the model needs recalibration)
Data quality on scored fields (fill-rate and freshness — a score is only as good as its inputs)
Schedule a scoring review every quarter. Re-examine criteria, weights, and thresholds. Your ICP evolves. Your product changes. Your best-fit segment shifts. The score must follow.
Stage 6: Activation (what happens after a score is assigned)
A score without an action is just a number. The real value of scoring is in the workflows it triggers.
Common activation patterns:
Tier A → immediate assignment: auto-assign to an SDR or AE (round robin or territory-based), create a task, trigger a Slack notification. SLA: contact within 24 hours.
Tier B → nurture sequence: enroll in an automated email sequence or add to a weekly "warm-up" batch for SDRs.
Tier C → hold: no active outreach. Revisit when enrichment improves the data or when intent signals spike.
High Hotness on any tier → alert: if a Tier B or even Tier C company suddenly shows high intent (demo request, pricing page visit), override the tier logic and route to sales immediately.
The scoring model feeds the assignment model. Together, they form the "who gets what, when" engine that makes prospection predictable instead of random.
What "good" looks like after scoring
After a well-built scoring model:
Sales knows who to call first. No more guessing, no more "I'll just work my existing contacts." The CRM tells them, based on data, not gut feeling.
Marketing can measure what works. If a campaign increases the Hotness Score of Tier A accounts, you know it's working — even before a deal closes.
Handoffs become objective. "This is a Tier A company with a High intent score" is a better handoff than "I think this one looks interesting."
Dashboards become trustworthy. Score-based views (pipeline by tier, conversion by score range, intent trends) give leadership a real picture of the revenue engine.
You're not "adding a score to the CRM." You're building the decision layer that tells your team where to invest their time and where not to.

